

Personal Insolvencies Australia
Published: July 7, 2026
Author: P. Dal Bianco
Having worked as an insolvency practitioner, and now approaching the system with a macroeconomic perspective, I’ve watched Australia’s personal insolvency landscape shift in a way that isn’t immediately obvious.
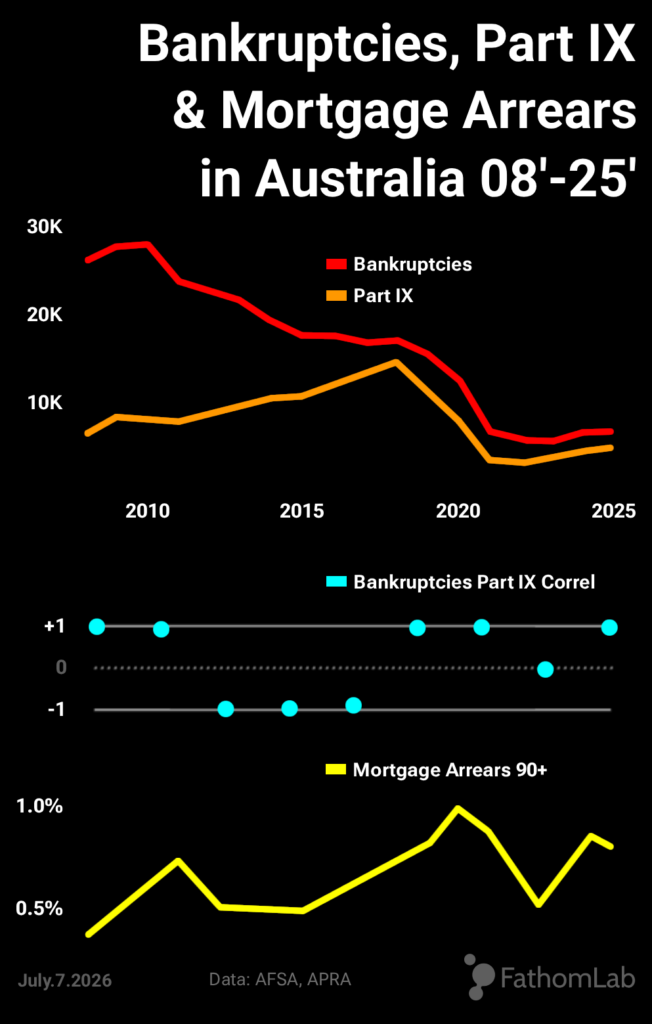
Historically, bankruptcies and Part IX agreements moved in broadly synchronised cycles, rising in periods of financial strain and easing when conditions improved. But over the past two decades, that synchronisation has fractured twice
— first between 2010 and 2018, and again between 2021 and 2025.
These breaks reveal a structural change in how secured creditors manage household distress, and how insolvency statistics now reflect strategy rather than stress.
The First Correlation Break: 2010–2018
Between 2008 and 2010, in the immediate fallout of the Global Financial Crisis, mortgage arrears surged, signalling mounting household pressure. Bankruptcies rose modestly alongside Part IX agreements, reflecting genuine financial strain. But from 2010 onward, the relationship between the two insolvency streams broke and flipped into a sustained inverse pattern: bankruptcies began collapsing while Part IX agreements continued rising, even as mortgage arrears moderated.
Post GFC pressures were never resolved, they were suppressed.
This extended divergence is the earliest and clearest demonstration of the mechanism now shaping Australia’s insolvency outcomes:
1. Mortgage arrears rise
2. Secured creditors manage mortgage stress
3. Part IX absorbs unsecured debt failure
4. Bankruptcy remains suppressed
This period is unaffected by COVID, stimulus, or policy distortions. It is a pure expression of creditor response.
The COVID Suppression Phase: 2019–2021
From 2019 to 2021, insolvency volumes collapsed across the board. Mortgage deferrals, hardship arrangements, stimulus, and enforcement freezes artificially suppressed both bankruptcies and Part IX agreements. Arrears fell, not because households became healthier, but because enforcement was postponed.
This period does not contradict the structural pattern
— it simply masks it.
The Second Correlation Break: 2021–2025
Once hardship arrangements rolled off and arrears began rising again, the pre COVID pattern re‑emerged.
Part IX agreements bottomed first, while bankruptcies reversed later and more slowly. The two series moved upward together, but not in sync
— Part IX led, bankruptcies lagged.
This is the same dynamic seen in 2010–2018, now operating in a post COVID environment. The mechanism is identical; only the timing differs. The intensity is not yet visible, but the early signs point to the same underlying pressure building.
Why Rising Arrears Don’t Produce Rising Bankruptcies
Mortgage debt changes the insolvency equation. A secured creditor cannot prevent a debtor from entering a Part IX or bankruptcy on the unsecured side, but it can manage mortgage arrears through hardship, extensions, interest only periods, or temporary forbearance. By doing so, the bank absorbs the shock of the debtor’s unsecured debt problems. If it enforces its security, the debtor is pushed directly toward bankruptcy
— the outcome the secured creditor is trying to avoid.
Bankruptcy forces the bank into a value destructive process involving possession, coordination with trustees, fire sale valuations, legal costs, delays, and regulatory reporting. It is administratively heavy and economically inefficient. Secured creditors will do almost anything to avoid triggering that machinery. If hardship fails, they still prefer a Part IX over bankruptcy.
Part IX agreements avoid almost all of the destructive mechanics of bankruptcy. They keep the debtor paying, preserve creditor control, and maintain the value of the security. As mortgage stress rises, banks have every incentive to push debtors toward Part IX arrangements rather than allow them to fall into bankruptcy.
The Result: Insolvency Statistics No Longer Measure Distress
This is why bankruptcy numbers remain suppressed even as financial pressure builds. Debtors are increasingly filtered into instalment arrangements or Part IX agreements, creating a structural suppression of bankruptcy and a sticky floor for Part IX volumes.
The data from both 2010 to 2018 and 2021 to 2025 shows this clearly: the two insolvency series break synchronisation precisely when arrears rise and creditor incentives tighten.
When household debt is dominated by mortgages, secured creditors become the decisive actors in shaping insolvency outcomes. Insolvency statistics stop reflecting true financial stress and start reflecting creditor strategies.
A Quiet System Under Strain
This correlation break matters. It means Australia’s bankruptcy data understates household distress and masks the pressure building in arrears, hardship arrangements, and balance sheets.
The financial system hasn’t become healthier
— it has become quieter.
And quiet systems under strain don’t resolve,
they build tension.
This part of the system will continue storing pressure until aggregate outstanding debt overwhelms creditor preferences and the enforcement boundary shifts. When that happens, possession stops being a last resort outcome and starts becoming the path of least resistance
— the moment when nine tenths of the law reasserts itself.
Insolvencies may have reached their inflection point in 2022, just around the time mortgage arrears rebounded, marking the earliest signs of a trend reversal as the system begins buckling under pressure it can no longer suppress.
In effect, the interventionary measures amounted to a decades long, creditor driven bail out of the household sector
— or, more precisely,
one final coordinated push by commercial lenders to capture the property market’s blow off top.
Related FathomLab articles:
Australia Housing Tax Reform 2026
Australia Auction Clearance Rates