
Australia Property Market Crash
Published: June 14, 2026
Author: P. Dal Bianco

Australia’s latest auction clearance rates are collapsing across every major city.
Sydney 51%
Melbourne 53%
Brisbane 25%
Adelaide 43%
Domain.com.au 7–13 June 2026
Investors have retreated,
and the data is exposing the immigration driven demand fallacy.
The property market isn’t cooling
— it’s cooked.
Demand is thinning.
Liquidity is drying up.
Queensland’s auction performance is alarming with an eye watering 75% failure rate, though hardly surprising, given its major cities function primarily as deeply financialised clearinghouses for wealth generated elsewhere. That makes its property market a structural canary in the coal mine for the broader Australian economy. Economists have acknowledged this for decades: every Australian recession has been preceded by a sharp correction in Queensland property.
Queensland has long been
‘the good times state.’
“Beautiful one day, hung over the next.”
The dismal auction result is revealing the state of Queensland has entered a systemic economic stall, and as the broader recessionary pressures take hold, the fallout there will be deeper, leading to a more protracted recovery that ushers in another lost decade mirroring the post 1990s malaise.
There’s another structural fracture forming beneath the market.
The 1 July 2026 demand cliff.
Australia’s new Anti‑Money Laundering (AML) regime for real estate begins on 1 July 2026, days after the CGT transitional acquisition deadline of 29 June 2026
— the last moment investors can buy property and still access the 50% CGT discount on gains accrued up to 30 June 2027.
This convergence of events creates a massive air pocket in demand.
Leading up to 30 June 2026 there will be
— a final rush of pre AML transactions, driven by investors trying to secure transitional tax treatment while avoiding the new identification and source of funds scrutiny.
From 1 July 2026
— a sudden collapse in transactional liquidity as every purchase after 1 July becomes subject to full AML onboarding, verification, and reporting while also losing eligibility to access the transitional CGT discount for gains accrued to 30 June 2027.
It is a demand cliff, and the Australian property market is about to drive straight off it.
Given the already weak clearance rates, the prospect of market conditions deteriorating further after 1 July 2026 is even more concerning.
If Australia’s housing market has been powered by greater fool economics,
then Queensland must be the final boss
— showing the ALP’s tax reforms are masterfully dismantling Ponzinomics.
This is what real leadership looks like.
Australians shouldn’t let those with vested interests in maintaining the toxic housing bubble distort the conversation.
Budget 2026–27 is delivering exactly what it promised
— lower house prices and, eventually,
an easing in rental costs,
as investors continue to offload properties into supply.
In an environment where policy, economics, and arithmetic are once again enforcing discipline, I am reminded of Gunnery Sergeant Hartman:
“You will learn by the numbers!”


Deep Correction Eclipsing
New Zealand & Canada
Published: July 3, 2026
The Australian housing market is facing its most hostile economic headwinds in decades. The “safe as houses” narrative has officially cracked. Affordability sits at record lows, credit conditions continue to tighten, and a wave of new supply is crashing into rapidly weakening demand
— all while policy reforms accelerate a structural shift in sentiment.
Taken together,
these systemic pressures point to a deep,
painful correction
— a drawdown of ~40% in some regions.
While market consensus will dismiss such a drop as impossible, history suggests otherwise. Look no further than the recent, brutal corrections in New Zealand and Canada, however Australia’s property bubble is far larger than those markets
— by orders of magnitude,
considering:
> Household debt: 120%+ of GDP
> Property market: ≈ 4.3× GDP
> Investor demand: ~40% of lending
That’s the trifecta of structural vulnerability.
Now, it could manifest as a sudden panic,
or it may simply be a long, slow,
orderly walk down the fire escape.

Brisbane Property Listings Skyrocket
Published: June 19, 2026
Author: P. Dal Bianco
⚠️ EMERGENCY MARKET ALERT
If you are in Queensland property
it is too late to leave.
Seek shelter now!
The hazardous low-demand system
has made landfall.
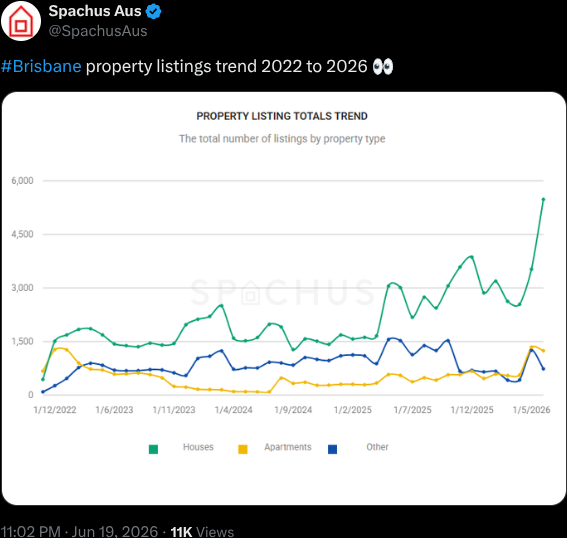
What we’re witnessing is not merely an uptick — it’s the formation of a classic parabolic structure, the kind that signals a market transitioning from expansion to exhaustion.
From a fundamentals standpoint, inventory and price maintain a well‑documented inverse correlation. As listings accelerate, price support weakens. But the critical element with a parabolic steepening in listings is how it alters the rate of change in property prices — the delta.
When supply breaks upward from its historical trend, the price‑response function doesn’t adjust proportionally; it accelerates. Corrections begin to move in multiples, not increments, pushing the market toward capitulation. It mirrors derivatives behaviour: when the underlying instrument swings sharply, the convex response amplifies the move.
The listings curve may look steep, but it is the price‑response function that becomes nonlinear. Once buyer absorption fails to keep pace with inventory velocity, prices don’t simply soften — they dislocate.
In practical terms, the downward trajectory in property values is likely to overshoot the listings surge by a significant margin.
The supply parabola is the warning.
The price parabola is the impact.
Brisbane Property Market Capitulation
Published: June 20, 2026
Author: P. Dal Bianco
Australia’s latest auction figures continue to buckle exactly where the structural weaknesses were already flashing red
— and as outlined in earlier analysis,
Queensland has notably dislocated from its peers, and has entered full market failure.
Australia Auction Clearance Rates
14–20 June 2026
Sydney 47%
Melbourne 52%
Brisbane 20%
Adelaide 54%
Domain.com.au 14–20 June 2026
Queensland’s sudden collapse in auction activity and explosive listing volumes are emerging as the epicentre of a contagion likely to spread nationwide.


The Rot Behind the Walls
Published: June 21, 2026
Author: P. Dal Bianco
Australia’s property market is softening after the government wound back key tax concessions, a move that has clearly contributed to the recent downturn
— but the public debate is overlooking the deeper structural rot the policy shift is seeking to contain.
The real decay inside the market’s structure comes from system‑wide mortgage fraud and widespread construction defects, both of which have quietly inflated valuations and undermined the integrity of housing stock for years.
These forces represent system‑level risks for the financial sector and the broader economy, plausibly running into the trillions, and they simply could not have been allowed to compound indefinitely. Price inflation was certainly a problem, but the larger issue was the capital (structural) and value (sentiment) formation underpinning those prices, built on unstable foundations within the lending system and the buildings themselves.
By removing concessions, the government may have forced the system to confront problems long entrenched, revealing that the real danger lay not just in high prices but in what was supporting them.
There is also this minor detail:
“The roll‑back of CGT concessions act as an end cycle fiscal hedge by shrinking the stockpile of carry forward capital losses into a slow growth economic recovery.”
Continue reading
Sellers Adjusting Expectations
Published: June 21, 2026
Author: P. Dal Bianco
Fresh data exposes widespread price weakness, with a high share of properties selling under asking price:
NSW 65%
VIC 82%
QLD 37%
PER 18%
Spachus.com.au June 21, 2026
The figures above are statewide averages.
Following are the worst performing regions where more than half of all sellers accepted lower offers:
Geelong 85%
Melbourne 80%
Sydney 72%
Wollongong 65%
Newcastle 62%
Central Coast 62%
These latest figures signal a buyers’ market is forming, with sellers increasingly accepting lower offers at unusually high rates. Sentiment is shifting, and pressure is mounting on vendors to adjust expectations across key urban and regional hubs as market conditions continue to soften.
Auctions Withdrawn Ratio
Published: June 23, 2026
Author: P. Dal Bianco
Auction withdrawals are one of the clearest windows into real‑time buyer demand. Unlike clearance rates, withdrawals capture the moment when vendors and agents decide the buyer pool is too thin to risk a public auction failure.
In practice, vendors withdraw from auctions when:
– Insufficient registered bidders turn up to make the auction competitive
– Agents expect the property to pass in and want to avoid a public failure
– Early buyer feedback signals insufficient demand at the vendor’s price
– The auction is unlikely to generate a desirable or defensible result
This makes the withdrawn vs scheduled ratio a powerful indicator of market stress. When this ratio rises, it reveals that buyer depth is deteriorating before scheduled volumes fall
— giving a cleaner read on sentiment before the headline metrics skew away from actionable insight.
The chart below shows that this ratio has moved sharply higher across the major cities.
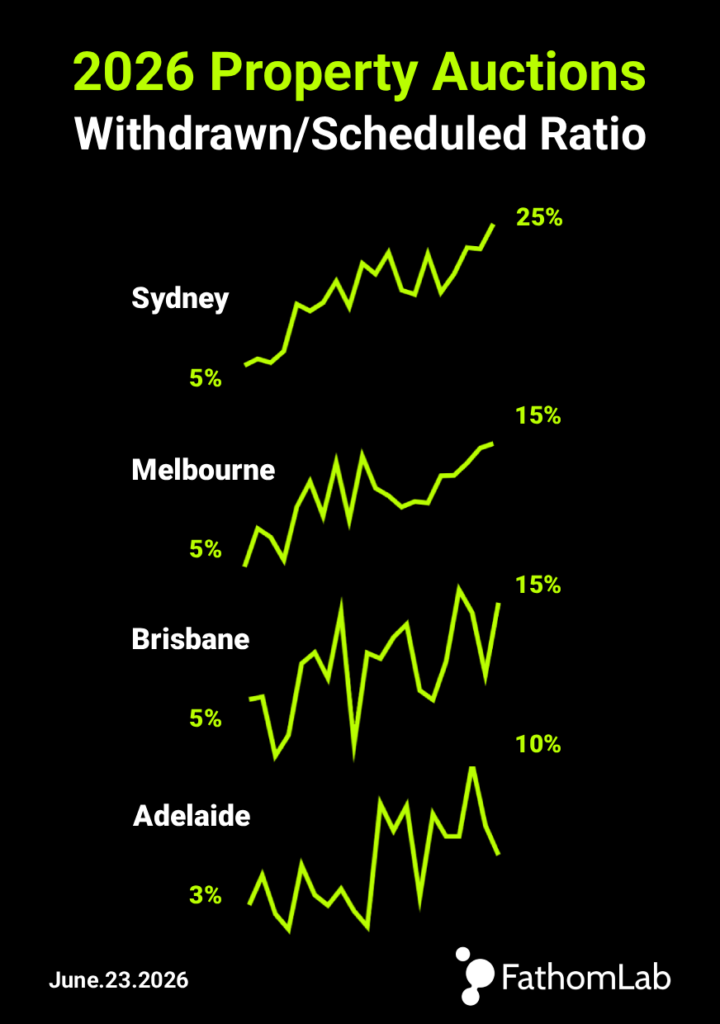
These increases point to a broad‑based shift in sentiment: vendors are stepping back because the pool of active, motivated bidders has thinned.
Historically, this pattern precedes:
– Lower clearance rates
– Higher vendor discounting
– Softer price growth
Rising withdrawals are the first tremor before the more visible indicators move and the ratio is presently signalling the Australian property market has entered a buyers’ market.

Mortgage Maxis Cry
“Devs, Do Something!”
Published: June 24, 2026
Author: P. Dal Bianco
Remember 2022, when everyone treated crypto investors like adolescents who had stuck a fork in a power socket? When FTX, Terra, and Celsius imploded, dragging the whole sector down turning crypto into meme fodder.
Yeah. Funny how quiet those laughs have gotten among the supposedly responsible adults playing Monopoly money with 30 year leverage.
Because now it’s property investors wandering around with that same dazed look
— the unmistakable face of someone who’s just realised the universe might be running a long form comedy bit at their expense.
And here’s the cosmic joke.
Crypto “degenerates” were at least torching their own cash.
Property investors? They’re juggling mortgage leverage so heavy it makes crypto margin traders look conservative.
When rates jump and valuations collapse,
there’s no “just HODL” or
“rotate into stables”.
There’s just the bank,
smirking like a Soprano
looking for their taste.
The vibe right now is Quasi-star delusion:
– Forced optimism that sounds like a makeshift hostage video
– Stockholm syndrome respite as debt hostages negotiate freedoms
– Virtue signalling “Crash? Who cares! What about the vulnerable!”
– “Slow immigration.” a view long deemed racism now acceptable
– Anger phase blamecasting “Why did the government allow this?”
It’s deliciously poetic when the supposedly responsible adults discover they are merely gamblers with better PR, dabbling in a tax subsidised asset class while confusing public underwriting for personal genius.
Some advice for Australian property investors:
start reining in that thousand yard stare,
and don’t fall into the sunk cost trap.

Related FathomLab articles:
Negative Gearing: ‘Now I Am Become Death, the Destroyer of Worlds’
— Oct 8, 2024
The Dragon Jaws of Australia’s Economy
— Oct 26, 2023
Australia Housing Affordability Crisis
— Sep 22, 2023

UPDATE: June 25, 2026
The Australian property market is making international headlines
— not for the right reasons.

It’s rare to see mainstream commentary openly link the ‘wealth effect’ to a housing downturn… but the Australian property bubble was bee‑lining toward a textbook case study for decades, slotted neatly after the Dutch Tulip Mania.
Bubbles never retire quietly, as I established in the Debasement Parabola.
Scheduled Auctions Tracking Below Median
Published: June 28, 2026
Author: P. Dal Bianco
Scheduled auctions offer one of the cleanest reads on vendor confidence. When sellers feel buyer depth is strong and nearby auctions are performing well, they list. When they don’t, scheduled volumes are the first metric to fall, well before clearance rates or withdrawals shift.
The latest trendlines across the major capitals show exactly that:
scheduled auctions have been drifting below long run medians.
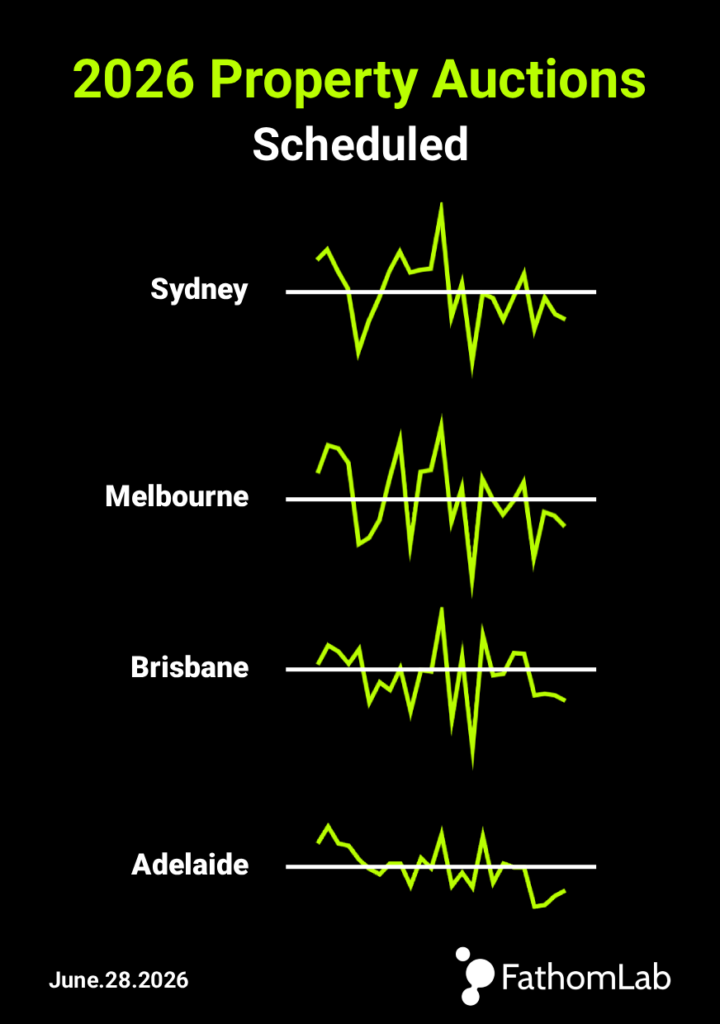
This is a simple but important signal. Vendors are stepping back from the auction platform.
When scheduled auctions sit below the median, it typically reflects:
– Reduced buyer depth
– Lower vendor confidence
– Preference for private negotiation
Historically, this pattern precedes softer price growth and a more buyer leaning market.
In 2026, the trendlines are signalling exactly that.
Sydney Auctions Six Year Low
Published: June 28, 2026
Author: P. Dal Bianco
Sydney has long been the bellwether market for Australian property. When the city that usually leads the flock posts its weakest auction results in six years, it’s a signal the rest of the country shouldn’t shrug off.
While Sydney sets the tone on the surface in sentiment, Brisbane reveals when the underlying structure starts to buckle. Together they form the bookends of the Australian property market
— NSW as the bellwether and QLD as the canary in the coal mine.
These two markets are worth watching closely for leading signals of broader shifts.
Scroll down to read the FathomLab report Australia Property Market Crash outlining why Queensland may be the canary in the coal mine for the broader property market.

UPDATE: June 29, 2026
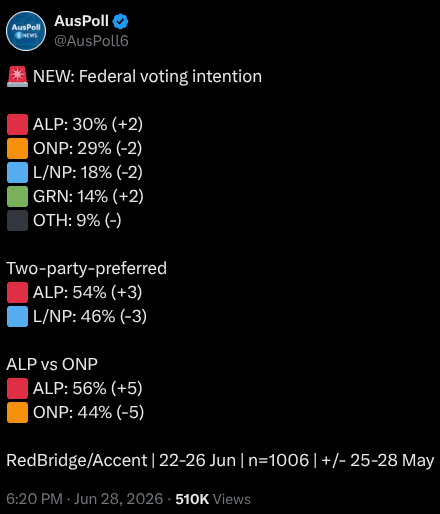
The latest polling shows solid ALP support, and with the budget tax reforms sailing through Parliament last week, the government is clearing the deadwood to get the nation’s economy back on course.
Crucially, by carving out targeted CGT concessions and incentives for startups, small businesses, and critical tech sectors
—such as AI development, crypto/blockchain, data centers
the ALP is expediting the structural shift away from the decrepit economy.
It’s a deliberate strategy to shield high growth industries and clear the path for genuine innovation and long overdue productivity gains long hindered by parasitic legacy systems.
It is now a matter of short term pain for long term gain
—and the youth are getting on board in numbers.
REMINDER: June 29, 2026
This week marks the Australian property market demand cliff.
29 June 2026 — the final day investors can purchase property and still access the 50% CGT discount on gains accrued up to 30 June 2027.
1 July 2026 — Australia’s new Anti Money Laundering regime for real estate begins, with all property transactions becoming subject to full AML regulatory compliance.
The coming months will reveal how heavily the market’s demand engine was drawing power from these twin nuclear reactors.

A Quick Rebound Unlikely
Published: July 1, 2026

Recent economic data and policy shifts all point in the same direction: mounting structural headwinds that make a sustained upswing hard to justify, and a rebound from the current downward trend in house prices looks increasingly unlikely.
The sector must now battle:
Trimmed mean CPI
— still elevated, signalling persistent underlying inflation. That keeps the RBA cautious and reduces the likelihood of rate cuts that would normally support a housing rebound.
Unemployment dipped recently
— a tighter labour market gives the RBA less incentive to ease policy.
Cash rate paused
— a pause at high levels means mortgage stress continues without relief.
CGT discount gone
— reduces investor appetite, especially for long term holds.
Negative gearing gone
— a major structural shift that dampens investor demand and reduces speculative buying.
AML rules for real estate
— tighter scrutiny on foreign and high value transactions pulls liquidity out of the market.
Credit tightening
— banks are applying stricter serviceability buffers, reducing borrowing capacity.
Weak household sentiment
— consumers remain cautious, especially with cost of living pressures.
Low real wage growth
— affordability constraints limit new entrants.
High construction costs
— keeps new supply constrained and delays projects.
Population growth slowing
— reduces demand pressure that previously supported prices.
In aggregate, these factors create a broad and persistent drag on the market. With economic conditions firming against rate cuts and policy settings shifting away from investor incentives, the path to a meaningful rebound is narrow
— and increasingly unlikely.
Against this backdrop, property investors are confronting what seasoned investors know all too well:
— decision paralysis that often locks investors into a sunk cost trap mindset.
Mortgage Strain Hits Record
Published: July 2, 2026
A new KPMG analysis reveals that Australian households are facing one of the heaviest interest repayment burdens on record surpassing the financial pressure felt during the infamous 17.5 percent cash rate peak of 1989.
Victoria currently carries the highest burden in the country, while recent 2026 interest rate hikes threaten to push national repayment pressures even higher.
Read article

Dwelling Price Decoupling
Published: July 3, 2026
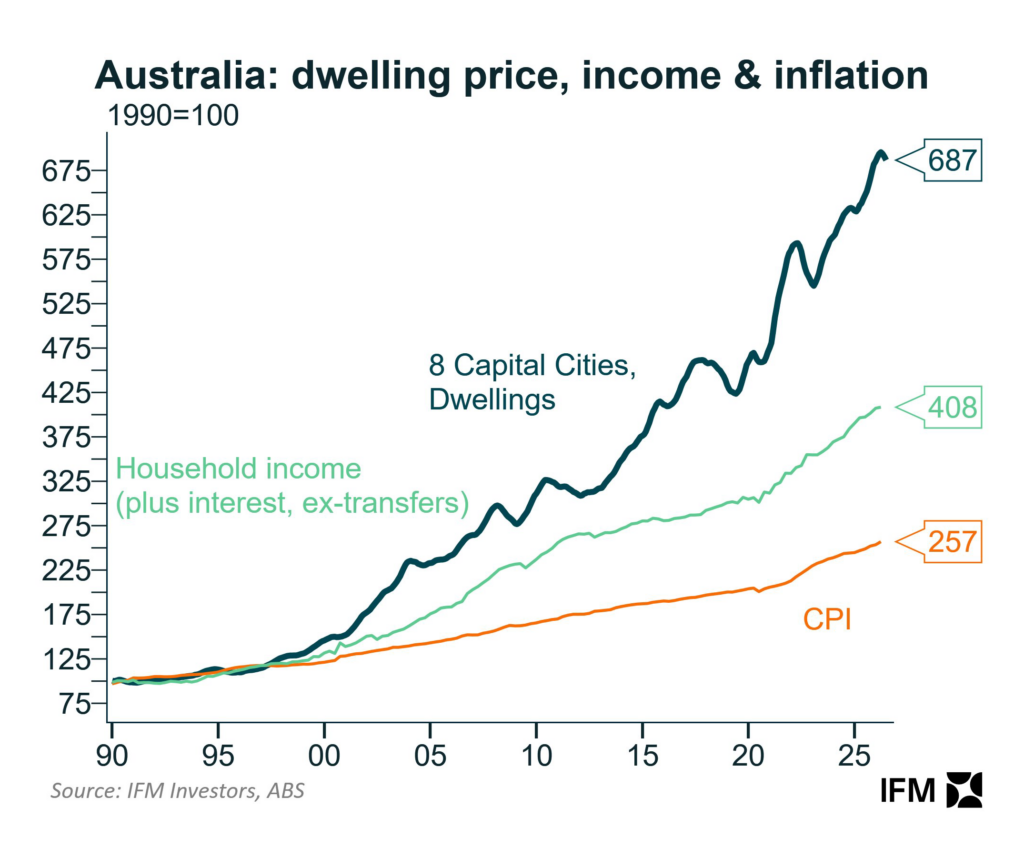
This chart from IFM Investors (ABS data) tracks the relative growth of dwelling prices across Australia’s 8 capital cities compared to household income and consumer inflation (CPI) from 1990 to 2026.
Housing Outperformance Massive
— Housing prices decoupled from household income and inflation circa 2000, surging disproportionately.
Affordability Gap Stretched
— Dwelling prices outpaced household income by a wide margin, showing a steep decline in housing affordability.
Demand Driven Inflation
— Both housing and incomes grew significantly in real terms pulling CPI upward.
Market Volatility
— While income and CPI rose steadily, dwelling prices experienced notable cyclical fluctuations and price corrections.
The data clearly highlights that capital growth in Australian housing has drastically outstripped the economic fundamentals of average income growth, pointing to structural affordability challenges, while simultaneously pulling up CPI to compound the issue.
An important note is the significant decoupling of housing prices from the other metrics accelerating around 1999
— which interestingly coincides with the year the Howard government introduced the 50% Capital Gains Tax discount.
Queensland Decouples
Published: July 4, 2026
Brisbane’s latest auction clearance rate has cratered to 16% according to Domain.
Sydney 51%
Melbourne 54%
Brisbane 16%
Adelaide 43%
Demand has evaporated.
Buyers have stepped back.
Queensland has always been Australia’s macroeconomic early warning system.
The demand cliff I’ve been flagging is no longer theoretical with:
— the 50% CGT Discount acquisition deadline of 29 June 2026,
and the start of the AML regime for real estate on 1 July 2026.
Queensland is simply the first cab off the rank,
as with most end cycle phases.
Sixteen percent isn’t a statistical outlier,
it’s confirming our running thesis.
Contagion is brewing.
Investor Loans Down 50%
Published: July 5, 2026
New investor mortgage demand has plummeted. A 50% plunge in investor lending is not a trivial fluctuation
— it’s a systemic risk signal,
especially in Australia’s property market,
where investor loan activity disproportionately props up aggregate demand,
representing ~40% of all new loans.
Combined with lengthening listing times, surging stock, and evaporating buyer confidence, it’s clear the market’s support pillars have fractured.
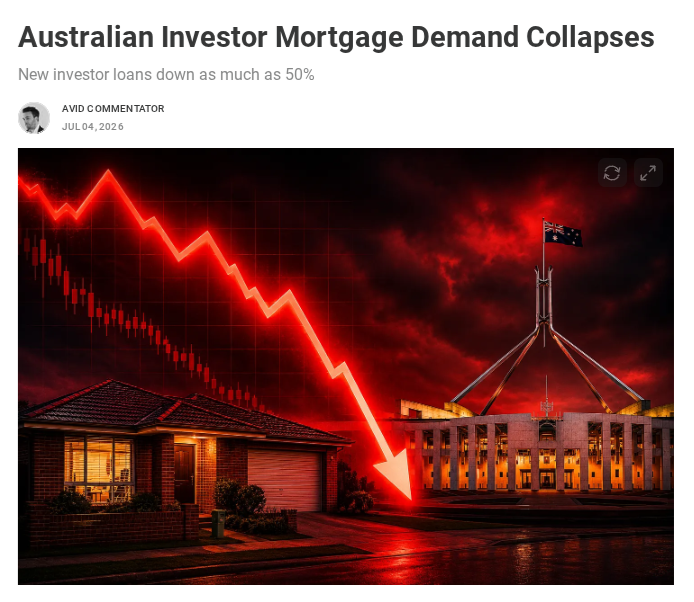
Anyone watching Australia’s housing market should pay close attention to these reversals. The next few months will be pivotal
— though given the rapid deterioration in key figures,
the acceleration suggests the visceral changes will arrive in weeks.
Read report
Median Listing Prices
Published: July 5, 2026
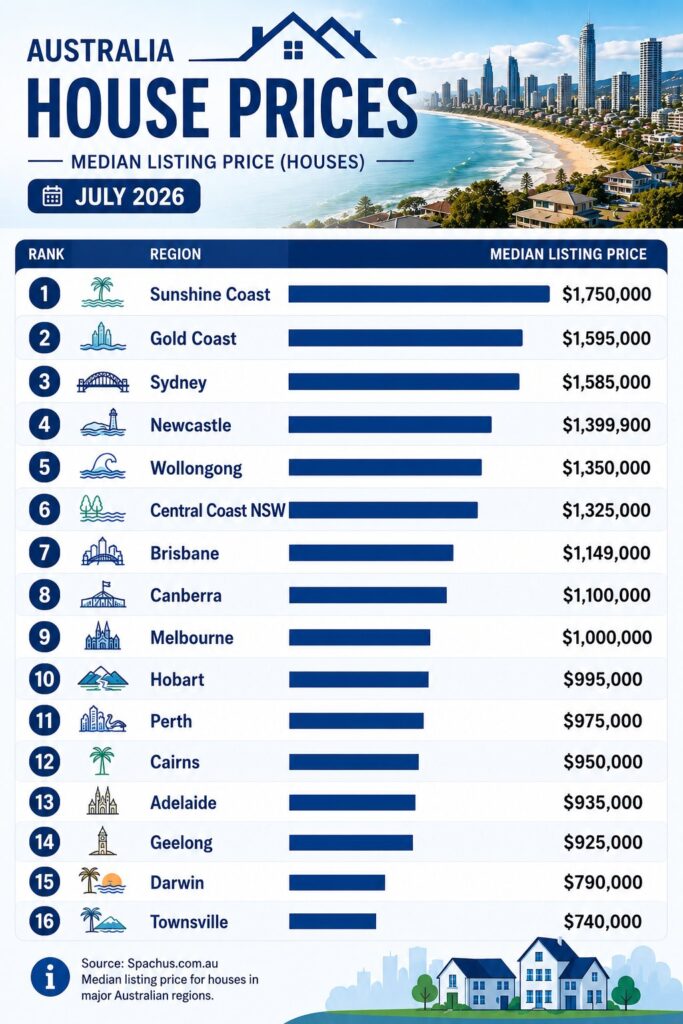
Australia’s latest median listing price data from Spachus.com.au puts Sunshine Coast at #1, Gold Coast at #2, Sydney at #3, with every one of the top seven markets located along the coast, and north of Wollongong
— a clean snapshot of how aggressively the baby boomer migration toward warmer, lifestyle centric regions has reshaped the country’s property map.
That equity rich northern drift didn’t just lift prices
— it over inflated markets that were never supported by broad, diversified demand. And as that demographic wave ages out, those same hotspots become the most fragile.
Queensland, after riding the biggest boom
— is ground zero for a deep national correction,
as FathomLab has been warning.
With baby boomers rapidly ageing out of the market, Queensland’s boomer fuelled hotspots will become a catalyst for a national correction.
PM Anthony Albanese
2026 NSW Labor Conference Speech
Published: July 5, 2026
“After 25 years of Howard and Costello tax breaks for property investors pushing home ownership out of reach, and beyond the aspiration of everyday Australian’s, we have taken action. We have reformed negative gearing and capital gains tax. At auctions all over Australia, for the first time in a generation, first home buyers are getting a fair crack. This is what delivering real change looks like.”
In many ways,
the Australian PM is pouring
new wine into new wineskins.
Demographics underwent a seismic shift,
and if that reality hasn’t yet registered,
it may be time to put the charts away,
and return to the basics.
Listen here

Personal Insolvencies Australia
Published: July 7, 2026
Author: P. Dal Bianco
Having worked as an insolvency practitioner, and now approaching the system with a macroeconomic perspective, I’ve watched Australia’s personal insolvency landscape shift in a way that isn’t immediately obvious.
Historically, bankruptcies and Part IX agreements moved in broadly synchronised cycles, rising in periods of financial strain and easing when conditions improved. But over the past two decades, that synchronisation has fractured twice
— first between 2010 and 2018, and again between 2021 and 2025.
These breaks reveal a structural change in how secured creditors manage household distress, and how insolvency statistics now reflect strategy rather than stress.
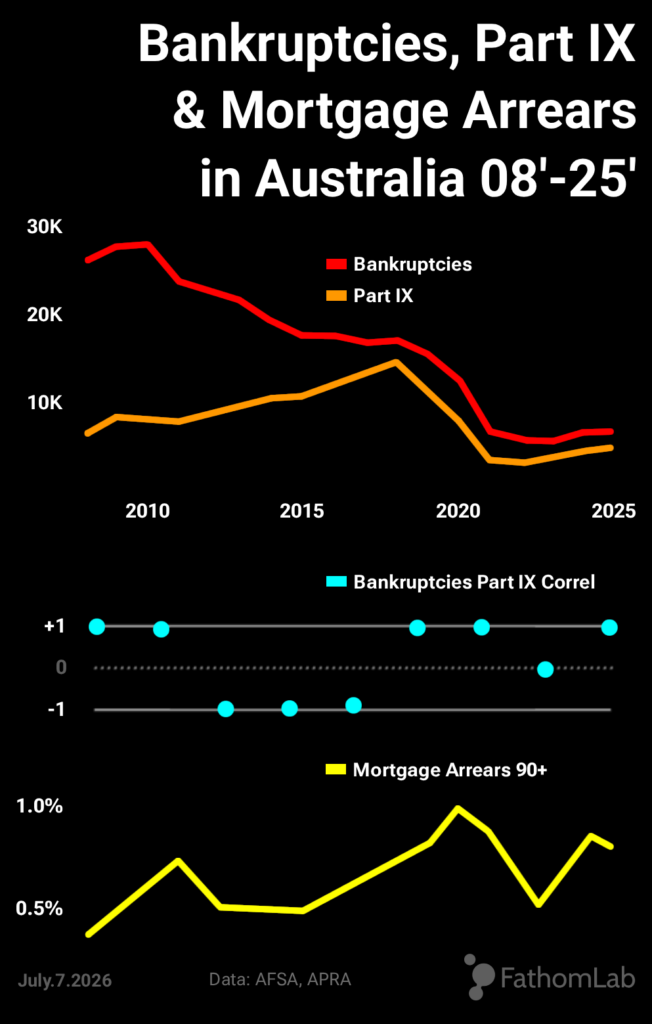
The First Correlation Break: 2010–2018
Between 2008 and 2010, in the immediate fallout of the Global Financial Crisis, mortgage arrears surged, signalling mounting household pressure. Bankruptcies rose modestly alongside Part IX agreements, reflecting genuine financial strain. But from 2010 onward, the relationship between the two insolvency streams broke and flipped into a sustained inverse pattern: bankruptcies began collapsing while Part IX agreements continued rising, even as mortgage arrears moderated.
Post GFC pressures were never resolved, they were suppressed.
This extended divergence is the earliest and clearest demonstration of the mechanism now shaping Australia’s insolvency outcomes:
1. Mortgage arrears rise
2. Secured creditors manage mortgage stress
3. Part IX absorbs unsecured debt failure
4. Bankruptcy remains suppressed
This period is unaffected by COVID, stimulus, or policy distortions. It is a pure expression of creditor response.
The COVID Suppression Phase: 2019–2021
From 2019 to 2021, insolvency volumes collapsed across the board. Mortgage deferrals, hardship arrangements, stimulus, and enforcement freezes artificially suppressed both bankruptcies and Part IX agreements. Arrears fell, not because households became healthier, but because enforcement was postponed.
This period does not contradict the structural pattern
— it simply masks it.
The Second Correlation Break: 2021–2025
Once hardship arrangements rolled off and arrears began rising again, the pre COVID pattern re‑emerged.
Part IX agreements bottomed first, while bankruptcies reversed later and more slowly. The two series moved upward together, but not in sync
— Part IX led, bankruptcies lagged.
This is the same dynamic seen in 2010–2018, now operating in a post COVID environment. The mechanism is identical; only the timing differs. The intensity is not yet visible, but the early signs point to the same underlying pressure building.
Why Rising Arrears Don’t Produce Rising Bankruptcies
Mortgage debt changes the insolvency equation. A secured creditor cannot prevent a debtor from entering a Part IX or bankruptcy on the unsecured side, but it can manage mortgage arrears through hardship, extensions, interest only periods, or temporary forbearance. By doing so, the bank absorbs the shock of the debtor’s unsecured debt problems. If it enforces its security, the debtor is pushed directly toward bankruptcy
— the outcome the secured creditor is trying to avoid.
Bankruptcy forces the bank into a value destructive process involving possession, coordination with trustees, fire sale valuations, legal costs, delays, and regulatory reporting. It is administratively heavy and economically inefficient. Secured creditors will do almost anything to avoid triggering that machinery. If hardship fails, they still prefer a Part IX over bankruptcy.
Part IX agreements avoid almost all of the destructive mechanics of bankruptcy. They keep the debtor paying, preserve creditor control, and maintain the value of the security. As mortgage stress rises, banks have every incentive to push debtors toward Part IX arrangements rather than allow them to fall into bankruptcy.
The Result: Insolvency Statistics No Longer Measure Distress
This is why bankruptcy numbers remain suppressed even as financial pressure builds. Debtors are increasingly filtered into instalment arrangements or Part IX agreements, creating a structural suppression of bankruptcy and a sticky floor for Part IX volumes.
The data from both 2010 to 2018 and 2021 to 2025 shows this clearly: the two insolvency series break synchronisation precisely when arrears rise and creditor incentives tighten.
When household debt is dominated by mortgages, secured creditors become the decisive actors in shaping insolvency outcomes. Insolvency statistics stop reflecting true financial stress and start reflecting creditor strategies.
A Quiet System Under Strain
This correlation break matters. It means Australia’s bankruptcy data understates household distress and masks the pressure building in arrears, hardship arrangements, and balance sheets.
The financial system hasn’t become healthier
— it has become quieter.
And quiet systems under strain don’t resolve,
they build tension.
This part of the system will continue storing pressure until aggregate outstanding debt overwhelms creditor preferences and the enforcement boundary shifts. When that happens, possession stops being a last resort outcome and starts becoming the path of least resistance
— the moment when nine tenths of the law reasserts itself.
Insolvencies may have reached their inflection point in 2022, just around the time mortgage arrears rebounded, marking the earliest signs of a trend reversal as the system begins buckling under pressure it can no longer suppress.
In effect, the interventionary measures amounted to a decades long, creditor driven bail out of the household sector
— or, more precisely,
one final coordinated push by commercial lenders to capture the property market’s blow off top.
Related FathomLab articles:
Australia Housing Tax Reform 2026
Australia Auction Clearance Rates